IATA’s 2023 Safety Report- good news
Meta Data and powerful analytics are contributing to enhanced aviation safety. The numbers become more powerful as the volume and frequency of the information increases. Seemingly insignificant incidents occurring at different airlines demand attention when the events and their specifics are aggregated.
International Air Transport Association (IATA) has published its 2023 Annual Safety Report and the results demonstrate the value of this data-based approach to RISK REDUCTION– “best-ever” results!!! On a global basis airlines are improving their safety measurements.
The Association now represents some 320 airlines in over 120 countries. Carrying 83% of the world’s air traffic, IATA members include the world’s leading passenger and cargo airlines. That membership and their dues supports a number of services for each airline.
The 2023 report is the most self-laudatory benefit. The Secretary General, Willie Walsh, tempers that praise by noting “THERE IS ALWAYS ROOM TO IMPROVE.”
Probably the most valuable function that this global airline organization provides is IATA’S GLOBAL AVIATION DATA MANAGEMENT (GADM) PROGRAMME. This data base aggregates information from 470 participants (i.e. more than its airline members) and thus, the analytics can deal with statistically relevant numbers. This mass justifies projections that alert the participants to potential safety risks. The trends identified likely would not be apparent to a single operator, but the META database can find trends.
GADM creates the following specific products, so relevant to the airline operational, pilot, maintenance, dispatchers, security, purchase staff, and senior management:
Incident Data eXchange (IDX)
The Incident Data eXchange is a worldwide aggregated de-identified database of incident reports, including flight ops, cabin, ground and security occurrences. It offers a secure environment providing users to view aggregated data against standards that are benchmarked with other counterparts.
Flight Data eXchange (FDX)
The Flight Data eXchange provides members with a comparative overview to highlight areas of flight safety concern, with benchmarking available at a global, regional and airport levels. It allows participating airlines to identify commercial flight safety issues comparatively for standard aviation risk areas.
Aircraft Maintenance Cost data eXchange (MCX)
The Aircraft Maintenance Cost data eXchange provides the methodology and the tools to capture and monitor aircraft maintenance costs as well as support data-driven decisions in cases of new fleet introduction or expansion, “make vs. buy” assessments, year-over-year trends, etc.
Accident Data eXchange (ADX)
The Accident Data eXchange provides a unique set of content making it easy to access integrated commercial aviation accident information. It provides official reports released after the final investigation, granting rate-based information which consists in normalizing accident numbers with global sectors, and performs analyses that are statistically relevant.
The FAA adds the following safety resources:
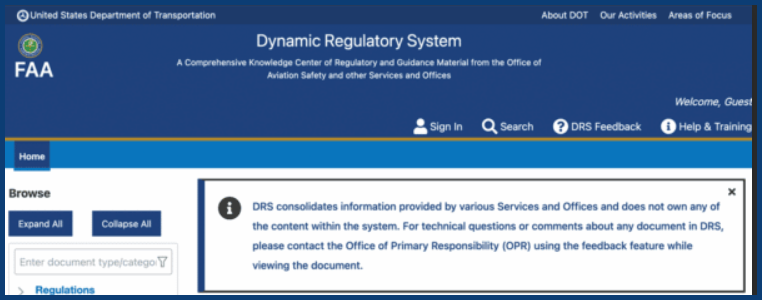
Dynamic Regulatory System (DRS): The Federal Aviation Administration (FAA) has introduced the Dynamic Regulatory System (DRS), a powerful tool that simplifies research on aviation safety guidance material. It consolidates more than 2 million regulatory guidance documents from various repositories into a single searchable application. These documents cover a wide range of topics related to aviation safety, including information from the Flight Standards Information System (FSIMS) and the Regulatory Guidance System (RGL). Each guidance document includes a link to the specific Code of Federal Regulations (CFR) provision it is based on. The DRS is updated every 24 hours and exceeds the requirements set by the FAA Reauthorization Act of 2018 for establishing a centralized safety database.
FAA Data Portal: The FAA Data Portal provides access to a catalog of publicly available aviation data. This continually expanding data catalog includes information such as SWIM data and other datasets. Researchers and industry professionals can explore this data to enhance aviation safety and efficiency. The portal aims to streamline data access, allowing users to spend less time searching and more time utilizing valuable information.
Safety Data Library: The Safety Data Library contains records related to the safety performance of airlines and aircraft. It serves as a valuable resource for analyzing safety trends, incidents, and other relevant data. Researchers and safety experts can access this information to make informed decisions and improve aviation safety
The word “DYNAMIC” of DRS emphasizes that this tool as well other safety data resources are evolving and refining their focus. Users should be aware that last year’s recommendation on a specific issue may have been amended by more recent analysis.
The Press has had a feast day reporting airline incident(s) and may now regard that a passenger light failure merits a front page story. Those nattering nabobs of negativity (thank you, VP Spiro T. Agnew for the alliteration), they need to read and report about the 2023 IATA Safety Report.

2023 Safest Year for Flying By Several Parameters
Geneva – The International Air Transport Association (IATA) released its 2023 ANNUAL SAFETY REPORT for global aviation. Aviation continues to make progress on safety with several 2023 parameters showing “best-ever” results.
There were NO HULL LOSSES OR FATAL ACCIDENTS INVOLVING PASSENGER JET AIRCRAFT IN 2023. However, there was a single fatal accident involving a turboprop aircraft, resulting in 72 fatalities. There were 37 MILLION aircraft movements in 2023 (jet and turboprop), an increase of 17% on the previous year.
Report highlights include:
- The all accident rate was 0.80 per million sectors in 2023 (one accident for every 1.26 million flights), an improvement from 1.30 in 2022 and the lowest rate in over a decade. This rate outperformed the five-year (2019-2023) rolling average of 1.19 (an average one accident for every 880,293 flights).
- The fatality risk improved to 0.03 in 2023 from 0.11 in 2022 and 0.11 for the five years, 2019-2023. At this level of safety, on average a person would have to travel by air every day for 103,239 years to experience a fatal accident.
- IATA member airlines and IATA Operational Safety Audit (IOSA) registered airlines experienced no fatal accident in 2023.
- A single fatal accident occurred in 2023, on a turboprop aircraft, resulting in 72 fatalities. This is reduced from five fatal accidents in 2022 and an improvement on the five-year average (2019-2023) which was five.
“2023 safety performance continues to demonstrate that flying is the safest mode of transport. AVIATION PLACES ITS HIGHEST PRIORITY ON SAFETY and that shows in the 2023 performance. Jet operations saw no hull losses or fatalities. 2023 also saw the lowest fatality risk and ‘all accident’ rate on record. A single fatal turboprop accident with 72 fatalities, however, reminds us that we can never take safety for granted. And two high profile accidents in the first month of 2024 show that, even if flying is among the safest activities a person can do, THERE IS ALWAYS ROOM TO IMPROVE. This is what we have done throughout our history. And we will continue to make flying ever safer,” said Willie Walsh, IATA’s Director General.
| ACCIDENT TYPE | 2023 | 2022 | 5-YEAR AVERAGE (2019-2023) |
| All accident rate (accidents per one million flights) | 0.80 (1 accident every 1.26 million flights) | 1.30 (1 accident every 0.77 million flights) | 1.19 (1 accident every 0.88 million flights) |
| All accident rate for IATA member airlines | 0.77 (1 accident every 1.30 million flights) | 0.58 (1 accident every 1.72 million flights) | 0.73 (1 accident every 1.40 million flights) |
| Total accidents | 30 | 42 | 38 |
| Fatal accidents | 1 (0 jet and1 turboprop) | 5 (1 jet and 4 turboprop) | 5 |
| Fatalities | 72 | 158 | 143 |
| Fatality risk | 0.03 | 0.11 | 0.11 |
| IATA member airlines’ fatality risk | 0.00 | 0.02 | 0.04 |
| Jet hull losses (per one million flights) | 0.00 (1 major accident every 0.00 million flights) | 0.24 (1 major accident every 4.11 million flights) | 0.14 (1 major accident every 4.94 million flights) |
| Turboprop hull losses (per one million flights) | 0.57 (1 hull loss every 1.76 million flights) | 1.76 (1 hull loss every 0.57 million flights) | 1.21 (1 hull loss every 1.03 million flights) |
| Total flights (million) | 37.7 | 32.2 | 32.9 |
Regional Safety Performance
The 2023 all accident rate improved compared to 2022 for all regions with the EXCEPTIONS OF NORTH AMERICA AND ASIA PACIFIC. No regions experienced a jet hull loss in 2023. Asia-Pacific recorded a fatal turboprop hull loss, a loss-of-control accident in Nepal in January 2023 with 72 fatalities. As a consequence, all regions except Asia-Pacific recorded a fatality risk of zero in 2023.
- North America: The all accident rate rose from 0.53 per million sectors in 2022 to 1.14 in 2023, but remained better than its 5-year average for the region of 1.21. The largest proportion of accidents in 2023 were related to landing gear collapses.
- Asia-Pacific: The all accident rate increased from 0.56 per million sectors in 2022 to 0.78 in 2023, but was better than the 5-year average for the region of 1.06. The fatality risk rate per million sectors rose for Asia-Pacific operators from 0.00 in 2022 to 0.16, owing to the fatal accident in Nepal in January 2023, which was due to loss of control in flight.
- Africa: The all accident rate improved from 10.88 per million sectors in 2022 to 6.38 in 2023, better than the 5-year average of 7.11. In 2023, there were no fatalities. This region has had no jet hull losses or fatal accidents since 2020. Additionally, 2023 marked the fifth occurrence of Africa reporting zero fatal turboprop accidents, with the first instance recorded in 2015. Under the Focus Africa initiative, IATA introduced CASIP to enhance aviation safety in Africa. CASIP efforts are continuing to partner with states to increase implementation of ICAO Standards and Recommended Practices (SARPs). The Global Aviation Safety Plan (GASP) as well as AFI Regional Aviation Safety Plan for Effective Implementation (EI) of ICAO ISARPs have increased the minimum SARPs implementation threshold to 75% or greater (from 60%). Only 12 of Africa’s 54 states meet this new threshold indicating the need for significant improvements.
- Middle East and North Africa: The all accident rate improved from 1.30 accidents per million sectors in 2022 to 1.16 in 2023. It remained slightly higher than the 5-year average of 0.96. While no accidents were related to GLOBAL NAVIGATION SATELLITE SYSTEM (GNSS) INTERFERENCE, IT HAS EMERGED AS A CRITICAL AREA OF CONCERN IN THE REGION.
- Commonwealth of Independent States: The all accident rate improved from 2.16 accidents per million sectors in 2022 to 1.09 in 2023. This rate is better than the region’s 5-year average of 3.19 accidents per million sectors. NOTE THAT CIS SECTORS MAY UNDERGO LARGER REVISIONS THAN NORMAL ONCE ACTUAL FLOWN SECTORS BECOME AVAILABLE. THIS WILL AFFECT ACCIDENT RATE AS WELL AS FATALITY RISK CALCULATION.
- Europe: The all accident rate improved from 0.98 per million sectors in 2022 down to 0.48 accidents in 2023. This rate is better than the region’s 5-year average of 0.77 accidents per million sectors. The region has had a fatality risk of zero since 2018. The largest proportion of accidents were related to landing gear collapses.
- North Asia: The all accident rate improved from 0.45 accidents per million sectors in 2022 to 0.00 IN 2023. This was better than the region’s 5-year average of 0.16 accidents per million sectors. The fatality risk rate improved from 0.23 in 2022 to 0.00 in 2023.
- Latin America and Caribbean: In 2023, the region reversed an increase in accidents from the previous year. The all accident rate per million sectors improved from 4.47 in 2022 to 0.37 in 2023, better than the 5-year average of 1.91.
Jet hull loss rates by region of operator (per 1 million departures)
| REGION | 2023 | 2022 | 2019-2023 |
| Africa | 0.00 | 0.00 | 0.28 |
| Asia Pacific | 0.00 | 0.00 | 0.19 |
| Commonwealth of Independant States (CIS) | 0.00 | 1.18 | 0.65 |
| Europe | 0.00 | 0.16 | 0.15 |
| Latin America and the Caribbean | 0.00 | 1.43 | 0.29 |
| Middle East and North Africa | 0.00 | 0.00 | 0.00 |
| North America | 0.00 | 0.00 | 0.04 |
| North Asia | 0.00 | 0.46 | 0.12 |
| Global | 0.00 | 0.24 | 0.14 |
Turboprop hull loss rates by region of operator (per 1 million departures)
| REGION | 2023 | 2022 | 2019-2023 |
| Africa | 2.42 | 9.40 | 5.04 |
| Asia Pacific | 0.87 | 0.00 | 0.28 |
| Commonwealth of Independant States (CIS) | 0.00 | 0.00 | 11.40 |
| Europe | 0.00 | 0.00 | 0.00 |
| Latin America and the Caribbean | 0.00 | 5.64 | 1.86 |
| Middle East and North Africa | 0.00 | 0.00 | 0.00 |
| North America | 0.00 | 0.00 | 0.35 |
| North Asia | 0.00 | 0.00 | 0.00 |
| Global | 0.57 | 1.76 | 1.21 |
IATA Operational Safety Audit (IOSA)
IOSA is the global industry standard for airline operational safety. It is also used by numerous authorities in their regulatory safety programs.
- Currently 425 operators are on the IOSA Registry, including 100 non-IATA Members.
- The all accident rate for airlines on the IOSA registry in 2023 was 56% better than the rate for non-IOSA airlines (0.69 vs.1.08).
- The 2019-2023 average accident rate of IOSA airlines was 0.84 per million sectors which is almost three times better than the non-IOSA average of 2.24.
- The 19 accidents involving IOSA members led to no hull losses or fatalities.
“IOSA registered carriers recorded no hull losses or fatal accidents in 2023. Since 2005, the all-accident rate for airlines on the IOSA registry is almost three times better than for non-IOSA airlines. This sustained performance demonstrates that the implementation of global standards improves safety. With IOSA’s recent transition to a risk-based model focusing on pertinent safety risks while maintaining a baseline of safety, IOSA will become an even more powerful tool to help airlines and regulators to maintain and improve very high levels of safety performance,” said Walsh.
Safety as a shared responsibility
A strong safety culture within the aviation industry is essential for continuous improvement in all aspects of operations. Creating an environment that encourages the transparent and timely reporting of incidents and accidents is essential to be able to identify systemic issues and prevent future occurrences. IATA is actively working on two fronts to bolster this effort:
- Enhancing Airline Safety Culture: In 2023, IATA introduced THE SAFETY LEADERSHIP CHARTER[1], designed to reinforce organizational safety culture through airline executives committing to the eight IATA safety leadership principles. To date 45 airlines have signed the charter.
- Encouraging States to Provide Timely, Comprehensive and Public Accident Reports: An IATA analysis of accident investigations from 2018 to 2022 showed that just over half are investigated and published as prescribed by the Chicago Convention. THE CURRENT SHORTFALL IN COMPLIANCE PREVENTS THE AVIATION INDUSTRY’S VARIOUS STAKEHOLDERS FROM ACCESSING VITAL INFORMATION THAT COULD SIGNIFICANTLY IMPROVE FLIGHT SAFETY.
“Safety enhancements and the prevention of future accidents stem from learning from past incidents. For AIRLINES, this means CULTIVATING A ROBUST SAFETY CULTURE WHERE EVERY EMPLOYEE FEELS ACCOUNTABLE FOR SAFETY AND IS MOTIVATED AND EXPECTED TO REPORT SAFETY-RELATED INFORMATION. For states, it involves providing timely, comprehensive, and public accident reports. OUT OF 226 ACCIDENTS IN THE PAST SIX YEARS, ONLY 121 FINAL ACCIDENT REPORTS HAVE BEEN MADE AVAILABLE. This shortfall is not only a blatant disregard for the Chicago Convention but also undermines the safety of our passengers and crew. Governments and their agencies must step up their efforts,” said Walsh.
Data Driven Approach
Data for IATA’s Annual Safety Report is collected through IATA’S GLOBAL AVIATION DATA MANAGEMENT (GADM) PROGRAMME, the world’s most diverse aviation data exchange programme. Data captured in GADM databases comprises accident and incident reports, ground damage occurrences and flight data from more than 470 different industry participants.
“By analyzing data from over 100,000 flights each day, through GADM, IATA is tackling safety issues before they become problems and continuously improving safety. For example, we identified a significant rise in incidents in Global Navigation Satellite System (GNSS) interference which we are now addressing with the help of key regulators such as EASA,” said Walsh.
[1] The IATA Safety Leadership Charter is a commitment by industry leaders to the continuous evolution of safety culture within their organizations and by IATA to support this evolution worldwide1. The guiding principles of the Charter include:
- Leading obligation to safety through words and actions
- Fostering safety awareness with employees, the leadership team, and the board
- Guiding the integration of safety into business strategies, processes, and performance measures
- Creating the internal capacity to proactively manage safety and collectively achieve organizational safety goals
- Creating an atmosphere of trust, where employees are encouraged and confident to report safety-related information
- Establishing a working environment in which clear expectations of acceptable and unacceptable behaviors are communicated and understood, creating an environment where all employees feel responsibility for safety
- Regularly assessing and improving organizational safety culture.
