What the 2022 IATA Safety Report Numbers tell airlines
SMS emphasizes the importance of data and their analysis in preventative safety risk management. IATA offers one of the largest compendiums of airline accident/incident information with records from more than 80% of the world’s scheduled airlines. The 2022 Safety Report is 23 pages long replete with not only numbers, but also some valuable insights. Here are a few prominent points:
– Accident investigations have identified a poor Safety Culture as a factor that increases the probability and severity of accidents. Inversely, an effective organization Safety Culture is one, if not the most important, enabler for successful implementation of an effective Safety Management System (SMS), leading to improvements in safety performance and operational resilience. And Safety Leadership is critical to deliver this success – it ensures a clear focus on safety, despite competing pressures, and sets the tone for how safety issues are addressed in the entire organization.
- Non-compliance to standard operating procedures (sops) was a contributing factor in 26% of accidents, followed by manual handling and flight control errors in 21% of the accidents
- Lack of or inadequate management decisions, including regulatory decisions, were a contributing factor in 10% of the accidents and deficiencies in maintenance operations was also cited in 10% of the accidents.
+ Though IATA remains focused on safety priorities, which include among others, runway safety, Controlled Flight into Terrain (CFIT), Loss of Control–In-flight (LOC-I), Traffic Collision Avoidance System Resolution Advisory (TCAS RA), while continuing to support the implementation of safety strategy, the study found—no accidents due to mid-air collisions, fuel exhaustion and CFIT.
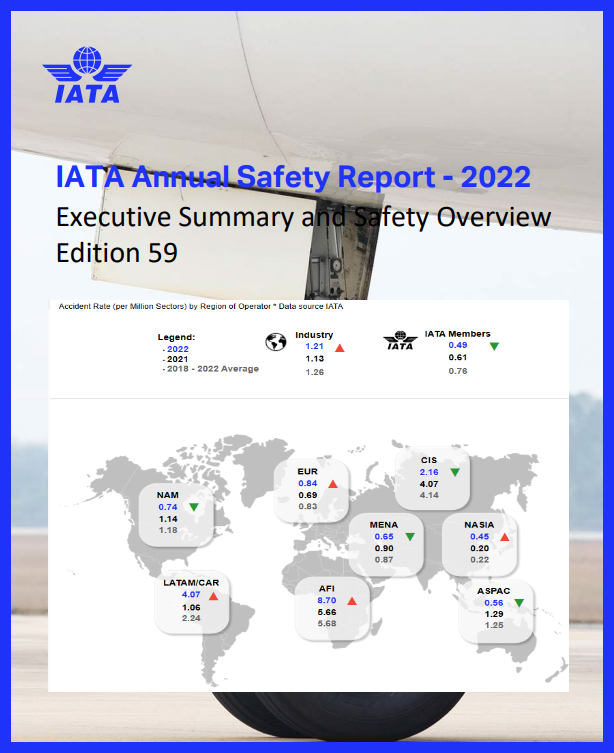
– Africa ranked as the worst region in terms of highest accident rate with 8.70 accidents per million sectors in 2022. This was up from 5.66 per million sectors in 2021, and was also above the 5-year average of 5.68 accidents per million sectors.
+ GOOD NEWS: the International Air Transport Association (IATA),the FAA, ICAO, the African Civil Aviation Commission (AFCAC), the Airlines Association of Southern Africa (AASA), and Boeing have launched a new program to enhance safety in the aviation industry. The Collaborative Aviation Safety Improvement Program (CASIP) will significantly reduce the rate of accidents and fatal incidents across the continent.
+ IATA’s premier aggregated data sharing programs, Incident Data Exchange (IDX) and Flight Data Exchange (FDX), continued to grow in leaps and bounds as we remain committed to our mandate of providing critical safety, security and operational data insights to our members to support the industry data driven decision
+ 2022 saw a continued improvement in Asia – Pacific’s historical accident fatality risk rates. No fatal accidents were registered in the region last year.
+ Taking a longer-term view, the industry has improved its overall safety performance over the last ten years by 48%, with an accident rate in 2022 of 1.21 accidents per million sectors, compared to 2.31 in 2013. In 2013, there were 11 fatal accidents that resulted in 173 fatalities. Over the past five years, there have been an average of about seven fatal accidents per year for commercial aircraft (passengers and cargo) resulting in an annual average of 231 fatalities. IATA continues its focus on supporting aviation stakeholders to continuously reduce the industry fatality risk
IATA Annual Safety Report 2022
[excerpts]
Safety Report Methods and Assumptions
Useful review of analytical tools and parameters
Accident Categories
The accident categories in 2022 listed in order of the number of fatalities (with the number of accidents in brackets) were:
- Other End State (3) with 138 fatalities
- Off Runway Touchdown (1) with 19 fatalities
- Runway Excursions (1) with one fatality
The accident categories in 2022 listed by the frequency of nonfatal accidents were:
|
|
|
|
|
|
|
|
|
|
|
|
|
|
Regional Overview
When considering accidents per region:
- Africa (AFI) had the highest accident rate with 8.70 accidents per million sectors in 2022. This was up from 5.66 per million sectors in 2021, and was also above the 5-year average of 5.68 accidents per million sectors; followed by Latin America & the Caribbean (LATAM/CAR) with 4.07 accidents per million sectors.
- The LATAM/CAR accident rate of 4.07 rose from 1.06 accidents per million sectors in 2021, and was also above the 5-year average of 2.24 accidents per million sectors.
- The industry witnessed a 50% reduction in the number of accidents1 involving Commonwealth of Independent States (CIS) operators, from 4 accidents in 2021 to 2 in 2022, neither of which involved fatalities. The region experienced 3 fatal accidents in 2021. The fatality risk improved to 0.00 from 2.29 in 2021.
- Operators in three regions: LATAM/CAR, AFI, and North Asia (NASIA) suffered fatal accidents in 2022, one of which involved jet aircraft (NASIA) and 4 of which involved turboprops.
- The jet fatality risk for NASIA operators went from 0.00 in 2021, to 0.23 in 2022. The turboprop fatality risk for LATAM/CAR went up from 0.00 in 2021, to 0.17 in 2022. AFI operators saw an improvement in the turboprop fatality risk from 7.15 in 2021, to 5.74 in 2022.
- 77% of the commercial air transport accidents in 2022 involved passenger flights.
- IATA membership and IOSA accreditation vs. non-IATA members and Non-IOSA Carriers continued a strong correlation with improved safety performance. The accident rate for IOSA-registered carriers in 2022 was lower than the rate for non- IOSA carriers. (0.70 vs 2.82).
- The jet hull loss rate per million sectors in 2022 was 0.17 vs 0.13 in 2021. Middle East and North African (MENA) operators have not reported a jet hull loss accident since 2015.
- The turboprop hull loss rate per million sectors in 2022 was 1.47 vs. 1.77 in 2021. European (EUR) and NASIA operators reported zero turboprop hull loss accidents since 2014 and 2015, respectively.
- The turboprop hull loss accident rate per million sectors for CIS in 2022 was zero vs. 42.53 in 2021.
Contributing Factors
When considering Threat and Errors Management, the most common factors cited in 2022 accidents were:
- Adverse weather condition was a contributing factor in 31% of these accidents. The weather condition most often cited as a contributing factor (18% of the accidents) was wind/wind shear/gusty wind and thunderstorm.
- Aircraft malfunction was cited in 21% of the accidents.
- Failure in the landing gear/tire was cited in 15% of the accidents.
- NON-COMPLIANCE TO STANDARD OPERATING PROCEDURES (SOPS) WAS A CONTRIBUTING FACTOR IN 26% OF ACCIDENTS, FOLLOWED BY MANUAL HANDLING AND FLIGHT CONTROL ERRORS IN 21% OF THE ACCIDENTS
- Abrupt Aircraft Control and Vertical, Lateral or Speed Deviations were contributing factors in 15% of the accidents, followed by Unstable Approaches and long landing in 13% of the accidents.
- LACK OF OR INADEQUATE MANAGEMENT DECISIONS, INCLUDING REGULATORY DECISIONS, WERE A CONTRIBUTING FACTOR IN 10% OF THE ACCIDENTS AND DEFICIENCIES IN MAINTENANCE OPERATIONS WAS ALSO CITED IN 10% OF THE ACCIDENTS.
- Overall crew performance and lack of monitoring and crossing checking, were contributing factors in 13% of the accidents. In flight Decision making was a contributing factor in 11% of the accidents.
